


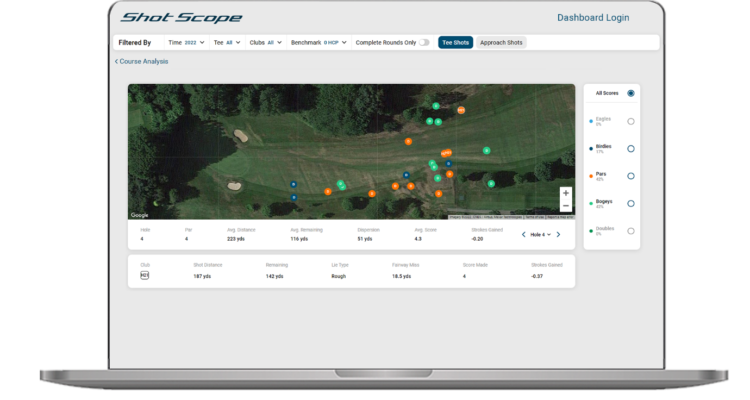
 Shot Scope continues to offer new ways in which golfers can analyse their rounds at their home course or one they have played multiple times – creating a visual map of how to play every hole on the course. From where you make birdies, to where you have struggled with bogeys, this new feature allows you to identify the best strategy to play the hole – maximising your chances of a low scoring round.With a new way to visualise performance, users will have the ability to delve into their golf game in as little or as much detail as they want. With a variety of filters available, the tool is there to assist golfers in the way that benefits them the most. Individual club used, end location of the shot, score, and an individual strokes gained benchmark score are some of the filters that can be applied so that golfers can analyse their game through a different lens each time.
“We wanted to provide our users with tour-level statistics that are displayed in a very digestible visual graphic to make the process of learning about your game as easy as it can be,” said Gavin Dear, Shot Scope’s chief commercial officer. “Having a tool that enables golfers to generate a data driven strategy for every hole will act as a personal score saver that players can refer back to during practice or playing. We’re proud to be able to share this with our community of golfers.”
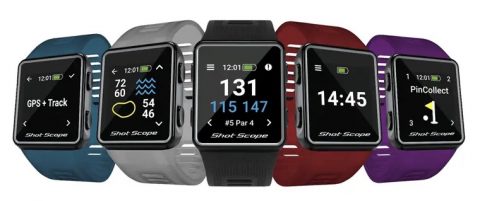
The ‘Shots Plotted’ feature can be used by golfers who own Shot Scope’s PRO LX+ laser/GPS, as well as any of its data tracking V2 and V3 watches via the Shot Scope app.