


Course-specific statistics give golfers a comprehensive map of how they typically perform at any given course. This feature will be most beneficial for home courses, with users traditionally tracking multiple rounds that can be broken down into useful data.
In addition to overall course analysis, Shot Scope has further advanced the performance data available through more specific, individual hole statistics. When looking at this data, it will give golfers a bespoke game plan for their home club based on prior rounds at that course.
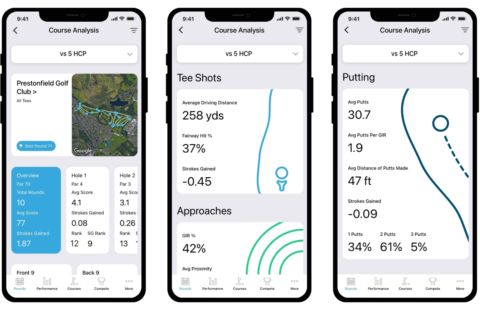
Information on up-and-down statistics from different areas, average score with different clubs off the tee, and heat maps of typical activity on each hole, will all be available to users to help shoot lower scores.
One statistic that offers a unique insight is the individual strokes gained ranking per hole. By compiling all rounds a golfer has played at a certain course, Shot Scope software is able to compute a ‘strokes gained’ ranking for each hole – which can then be compared to the course hole ranking. This also enables golfers to benchmark against players with similar handicaps on the same course, as well as comparing their performance against other golfers at their club.
 Not only is this informative to the user, but also to coaches who can get a more detailed, statistically-driven, understanding of how their clients are performing out on the course. The information can be used to structure and guide lessons, as well as helping golfers plan out their course strategy before an event.
Overall up-and-down statistics are displayed in a clear graph, highlighting the percentage from each miss zone – showcasing where a golfer traditionally makes the highest number of up-and-downs from. This interactive and visual display of data allows golfers to easily navigate the intricacies of their game, in what can otherwise be a confusing process. When combined, the course and hole analysis features provide key awareness into how golfers can map their way round the course in a more efficient manner.
The new analysis feature is available to all Shot Scope users who are currently using a product with shot tracking technology, including the V3, H4 and PRO LX+, and is accessible through the mobile app.
To find out more, head to www.shotscope.com.